Patterns
Crime around UIC vs The Loop
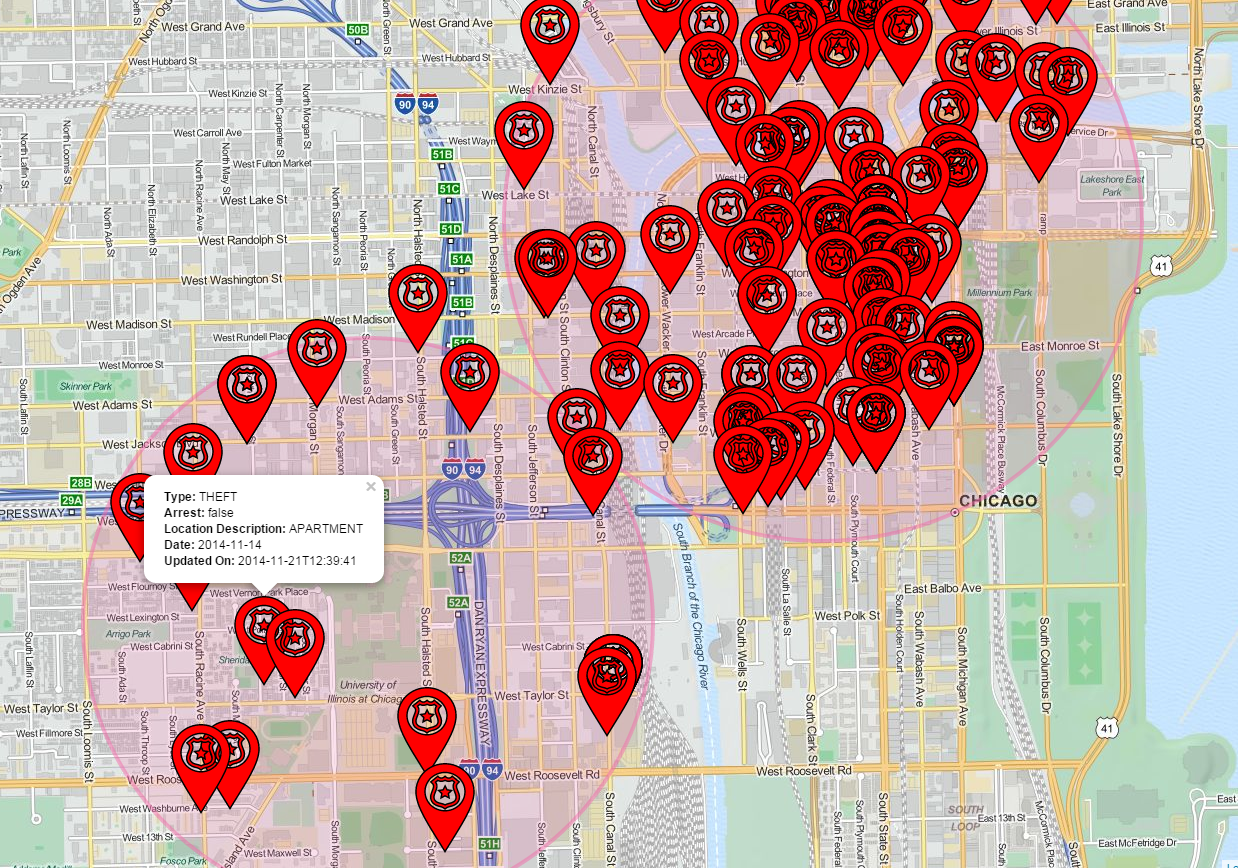
After comparing crime event markers around UIC and The Loop for both the last week and the last month, the following patterns can be observed:
- The quantity of crime events recorded in The Loop is far greater than crime events near UIC.
- The vast majority of crime around UIC is THEFT, followed by a few other types.
- The majority of crime in The Loop does seem to be THEFT, but is closely followed by DECEPTIVE PRACTICE, BATTERY, and CRIMINAL TRESPASS.
Crime around Hyde Park
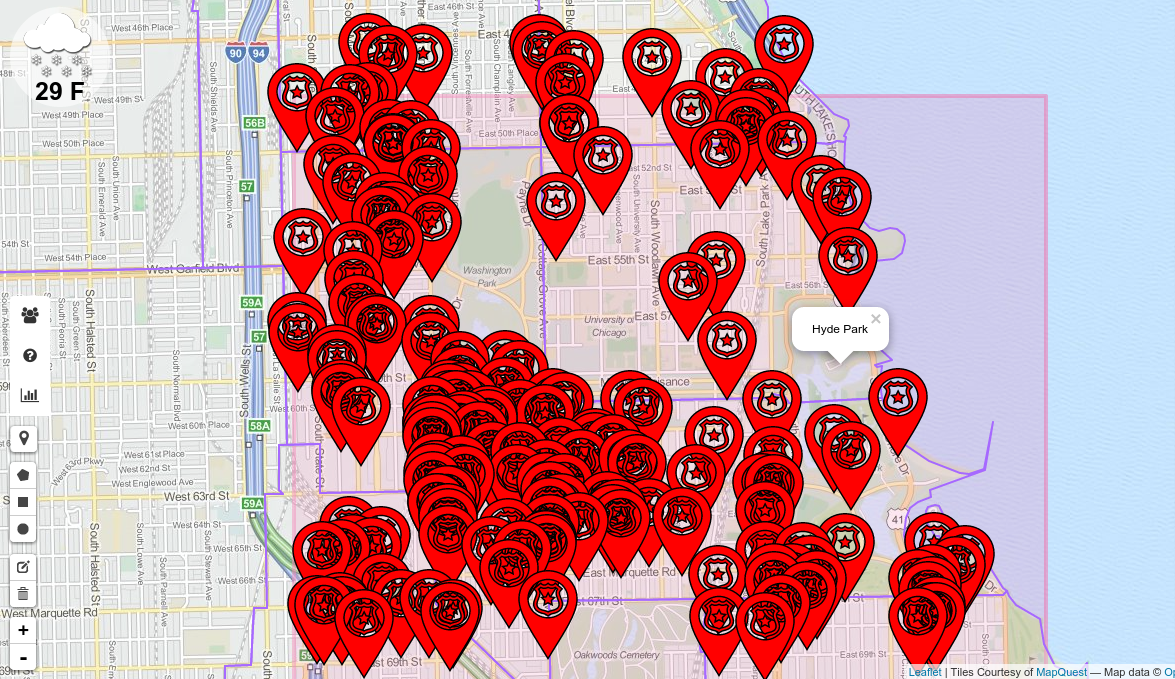
From observing how crime is concentrated on specific areas we can see how extreme this is especially around the Hyde Park area. We observed that:
- The number of crimes drops significantly in Hyde Park compared to regions surrounding it.
- The vast majority of crime in Hyde Park is THEFT and some ROBBERY.
- There is more violent crimes in the areas that surround Hyde park such as BATTERY and PROSTITUTION.
Crime near touristy areas
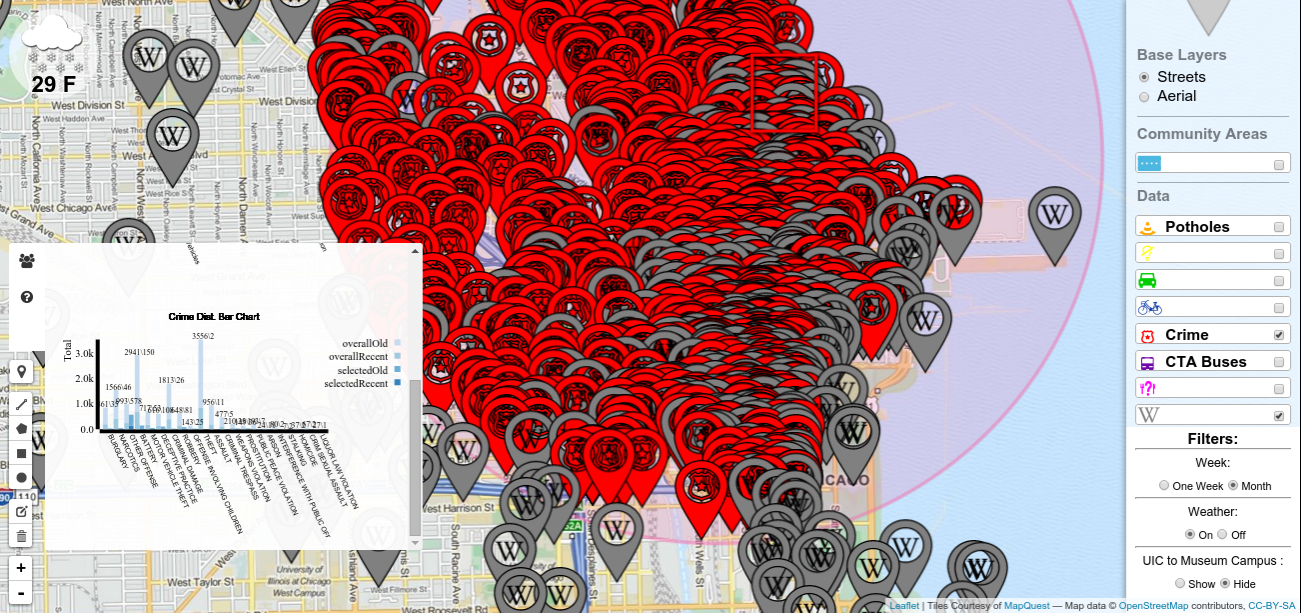
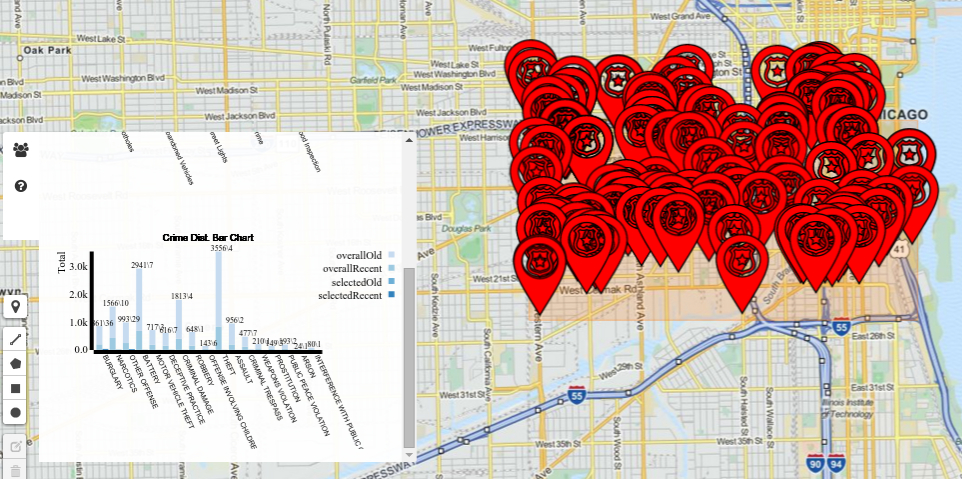
We examined the area where the most wikipedia information is found, (the loop of course), and made oversvations about the crime here. Note the following visualization on this.
Here we see oddly that there is hardly any theft here (only 2 occurence as of the past month). Infact, the highest occurrence of crime is "other crime" at 150 incidents reported in the past month. This tells us that it is relatively safe area. On the other hand, there is quite a bit of narcotics use (that is, 578 incidents reported), probably because the people in the loop are generally paid well and under high stress, so perhaps they turn to drugs because it is easy to obtain and possibly relieves stress.
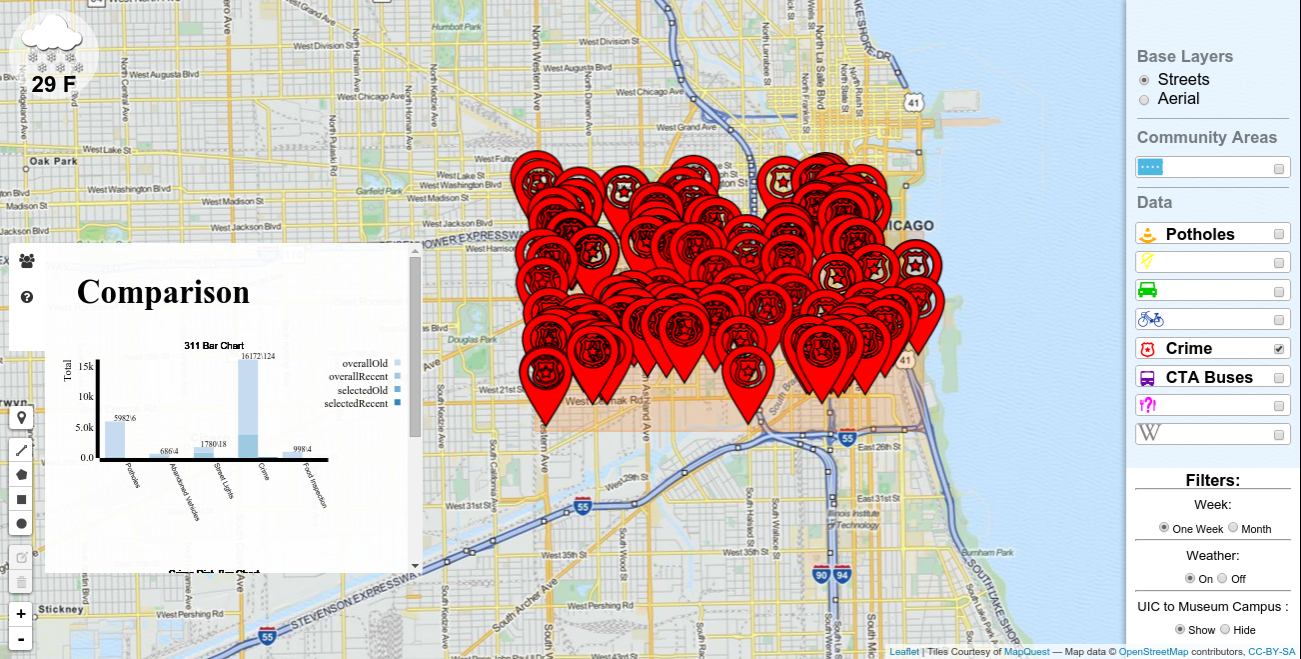
Abandoned vehicles in the loop
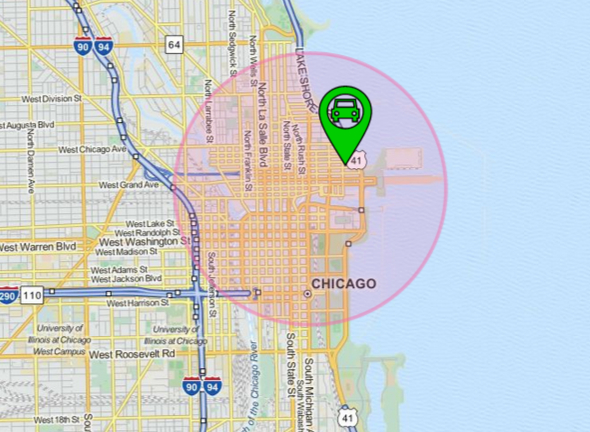
We find it interesting, and probable that there are hardly any abandoned vehicles in the downtown area! In fact, as of the past month, you only see one in the downtown area of Chicago selected in the screenshot above.
Potholes on North/South running streets
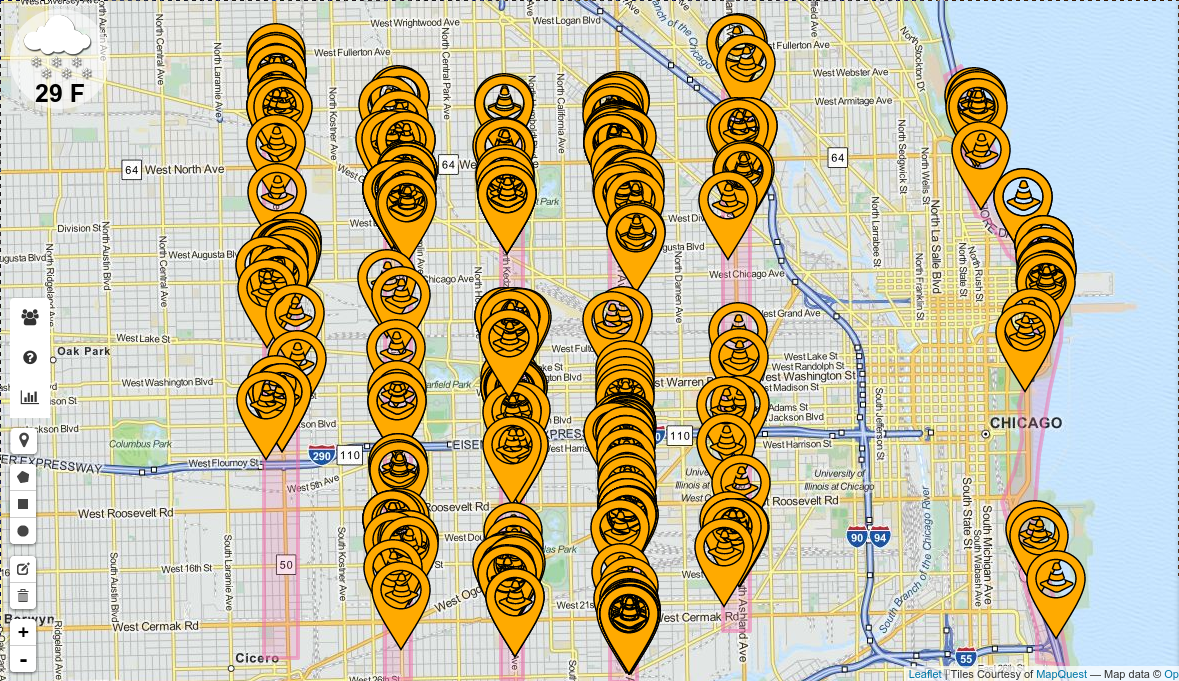
From looking at the potholes on the selected streets we observed that:
- The street with the most potholes from the selected streets is Western.
- LSD has a low number of pothole relative to the other streets.
Other Findings
Lower Wacker car groupings
In the screenshot below, you can see a small grouping of abandoned cars on Lower Wacker near Navy Pier. We noticed this type of grouping in a few places and are a bit perplexed as to their origin. Perhaps it's a towing agency's storage lot? That still wouldn't explain why they are reported as "abandoned" and not "towed".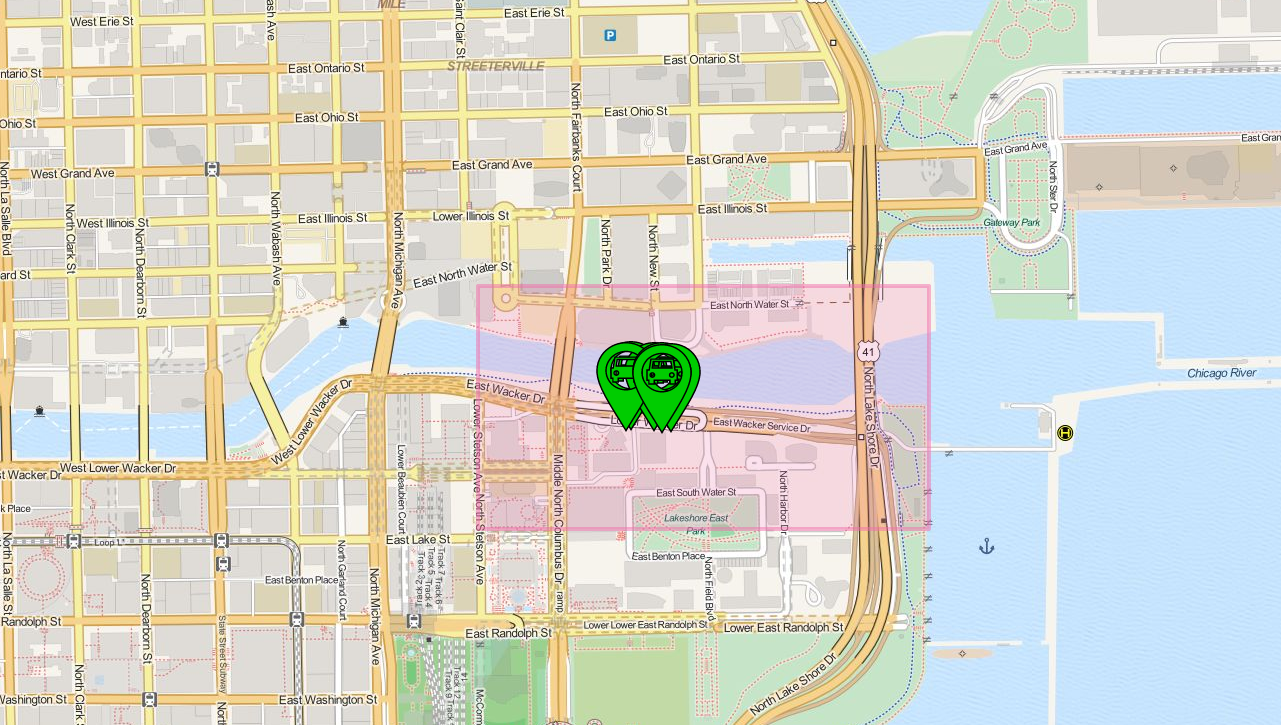
CTA longitude / latitude accuracy
It seems that the CTA buses' location is given to AT LEAST 15 digits to the right of the decimal. This was determined by counting the digits on a single bus' location and there were 15 (some other buses might have reported more.What does the 15th decimal of lat/lon mean? If you add 1 to the 15th digit, you are now at an order of magnitude above nanometer scale.
Example using JS math found at the to of this page:
If you add 1 to the least significant digit of the latitude:
lat1 = 41.86403739452362;
lon1 = 87.7445912361145;
lat2 = 41.86403739452363;
lon2 = 87.744591236115;
This comes out to a diff of 4.119573810999978e-11 km, or 4.11957e-8 m, or 41.1957 nanometers! While we aren't actually making use of such a precise scale of data, it is worthwhile to note the quality of data we have access to.